Resources for the global digital safety training community.
Activity & Discussion: Data Backup Matrix - Creating an Information Map
ADIDS Element
Activity and DiscussionParent Topic(s)
Data Backup BasicsDuration
30-45 minutesMaterials to Prepare
- Post-it Notes (multiple colors)
- Markers (multiple colors)
- Flipchart paper or butcher block
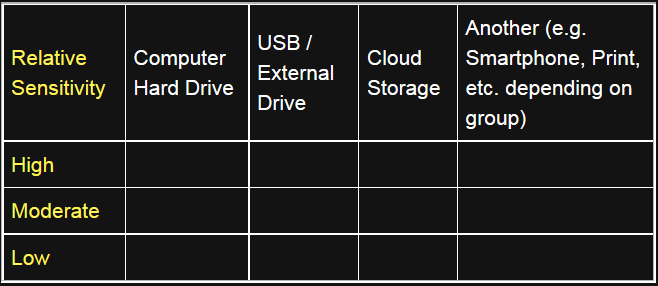
- One larger sheet of paper, taped to a wall in landscape orientation, with or without prepared titles (see the matrix below.)
Optional
Include an axis denoting the relative sensitivity of data (steps in the activity highlighted below). This adds time to the activity, but can help reinforce risk management as a theme during your training.
Running the Activity
In an ideal scenario, the participants have a high level of trust with each other and will be comfortable speaking freely. In situations in which participants are unfamiliar to one another, trainers may want to try to break a larger group up into teams or small groups that share similar situations.
Step 1: Where is Our Data?
Explain to participants that this session will cover an information mapping activity, the purpose of which is to get a sense of what and where our important information and data actually is. Start by listing the different places where our information is stored, according to participants.
If no suggestions are forthcoming, trainers can prompt participants with some of the more common storage media and locations:
- Computer hard drives
- USB flash drives
- External hard drives
- Cellphones
- CDs & DVDs (and BDs)
- Our email inbox
- Dropbox, Google Drive, SkyDrive, etc
- Physical (“hard”) copies in the office
- Video tapes, audio recordings, photographs, etc.
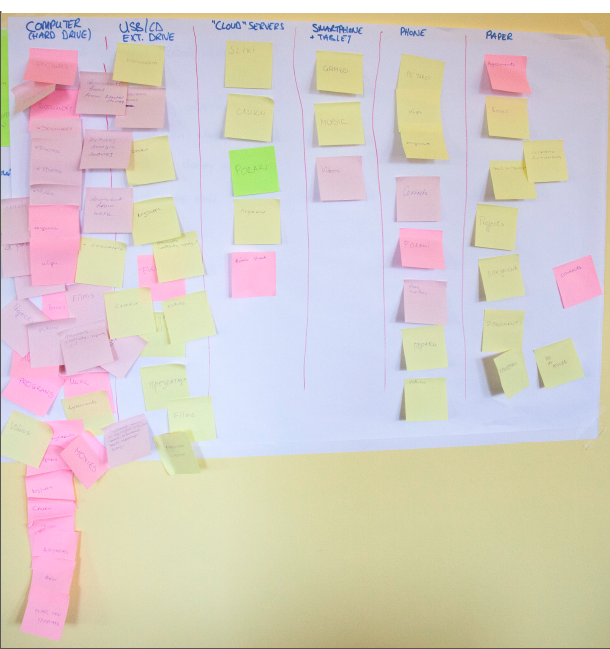
Add these titles to the sheet or whiteboard and construct the matrix (see the figure above) around them if you have not already done so.
Step 2: What is Our Data?
As a next step, begin to elicit from participants what types of information or data they have in each of the above places. Some examples might include (again, these are useful to kick-off with if no suggestions are forthcoming):
- Email correspondence and messages
- Contact details, such as a member contact database
- Reports and/or research documentation
- Budget and financial accounts, spreadsheets, etc.
- Videos and images
- Audio recordings or files
- Private messages on Social Networks
To encourage participant interaction, write one of the above examples on a post-it note and affix it to the appropriate box within the matrix; then, ask whether there is another copy of this data in another storage medium or location. If there is, you can use another sticky (preferably of a different color) and affix it within the appropriate box for where the duplicate is kept. You can use this moment to teach the difference between master copies and duplicates.
Repeat this process with another example, hopefully provided by a participant.
Optional
If including the sensitive / non-sensitive axis, refer back the two examples and introduce the axis representing sensitivity. The higher on the chart, the more sensitive the data - place the two stickies on this axis, in locations representing their relative sensitivity.
Step 3: Participant-Created Matrices
For this step, now divide the group into smaller teams - it helps if there are relatively clear thematic distinctions within the group, such as nationality, type of work, supported community, etc. Have a large sheet of paper with an unfilled matrix ready for each group.
Next, walk your participants through the following set of instructions:
-
Each group will be given two sets of post-it notes, each set a different color, and each participant should think of the 5 most important types of data they work with. They should write one type per note.
-
For any type of data that has a duplicate location, they should represent this with a different colored post-it note. For instance, if the two post-it colors are Yellow and Pink, have all master versions of the data be Yellow and any duplicates of that master be Pink.
-
When each participant in a team has their top 5 most important data types created, they should go to the team’s matrix and affix their completed post-it notes within the relevant boxes.
-
Give participants 5-10 minutes to work on identifying their types of data. Once the time is up, there should be one completed matrix per team.
-
It might be useful to go from team to team, identifying interesting characteristics of each matrix. For example, note where there is particularly heavy dependence on one device, or where there’s a lack of duplicate stickies, etc.
An example may look something like this:
Step 4: How Could Things Go Wrong?
Explain that this exercise helps to give us a useful, visual sense of where our data is stored.
Elicit from participants whether or not the information represented on these matrices, in their opinion, covers all the data we generate?
The answer is, in reality, no.
It demonstrates only a small percentage of the data we all generate each day, whether we are aware of it or not. Referring to one of the teams’ matrices, for example, mention the information that is shown as kept on their computer hard drive - this will usually be the fullest part of many matrices produced during this exercise, otherwise mention whichever storage location appears to have the most data stored on it.
Using the example of the computer hard drive, elicit from the group some examples of things that can cause a computer to stop working or otherwise make the data stored on it inaccessible.
Perhaps take a show of hands - who has had this happen to them?
- Virus or malware attack could destroy or corrupt data stored on a hard drive.
- A computer could be stolen or confiscated.
- Infrastructural problems, like a power failure or a power surge, could render it inoperable.
- Unstable software or operating system could potentially brick a computer.
So, what if any of the above happens? What happens to all this data?
- Dramatically remove each of the stickies from the column, maybe throw them on the floor, etc.
- Gesture to the remaining stickies in the other columns - this is all that we’ll be left with!
So what can we do to avoid this? We should put more copies into different locations - this is called backing up.
(Optional) Step 5: Sensitive Data in the Wrong Hands
The sensitive / non-sensitive distinction in the matrix is optional, and should only be done with enough time to drive adequate discussion about the relative sensitivity of information. It can also be presented as a scale rather than a dichotomy.
Take the example of a second team’s data if possible, and/or another column on the matrix of the first team:
- What if your computer hard drive, mobile phone, etc. is stolen or your sensitive account password is cracked?
- Remove the stickies from the column but keep them in your hand and read them.
- Use this to represent a third-party with unwanted access to this information.
What could they do with it? What are you, the user, left with?
Leading the Discussion
Some questions are included below to lead a quick discussion on the issue - given that much of the activity portion involves discussion among the trainer and participants, you may keep this phase of the session brief if you wish.
- How would it feel to lose all this information?
- Has anything similar happened before, are there any personal examples we can learn from?
- If we were doing the exercise again, what would they do differently? What would they back up?